What Is Zabbix? A Deep Look Into Its Strengths and Use Cases
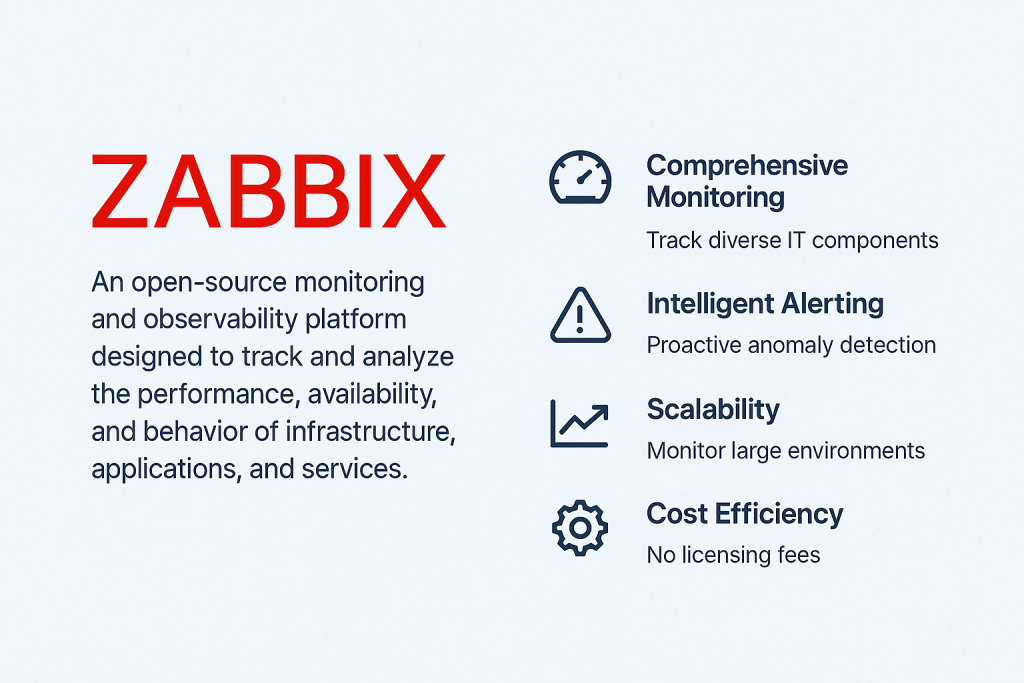
Zabbix is an open-source monitoring and observability platform designed to track and analyze the performance, availability, and behavior of infrastructure, applications, and services.
It aims to provide a comprehensive, unified view of your IT ecosyste-eliminating silos, reducing blind spots, and empowering teams to become proactive rather than reactive.
Core Architecture and Components
To understand Zabbix’s advantages, it helps to see how it’s built:
Zabbix Server – the central component that processes data, triggers alerts, and stores monitoring metrics in a database.
Database Backend- supports systems like MySQL, PostgreSQL, Oracle, etc., to store histories, configurations, trends.
Zabbix Agent / Agentless Methods – on hosts, the agent collects detailed metrics (CPU, memory, disk, processes). But monitoring is not limited to agents: SNMP, IPMI, JMX, HTTP, external scripts and other techniques are supported.
Proxy / Distributed Nodes – for monitoring remote sites, branch offices or to offload load, proxies collect data and forward to the central server.
Web Frontend & API – a browser UI (in PHP) allows configuration, visualization, dashboards, and APIs allow integrations and automation.
This architecture gives Zabbix flexibility, scalability, and extensibility to handle very large environments.
Key Strengths and Advantages
Below are the principal benefits Zabbix brings to organizations, especially when handled by an experienced team like Taurix:
1. Comprehensive & Flexible Monitoring
Zabbix supports monitoring of almost anything that generates metrics:
Servers (Linux, Windows, Unix), virtual machines, containers, cloud resources
Network devices (routers, switches, firewalls) via SNMP, traps, or polling
Applications, databases, logs, web services, APIs, business metrics
IoT, custom scripts, sensor data, or external data sources
You can mix agent-based and agentless monitoring as needed, giving you flexibility across environments.
2. Intelligent Alerting, Anomaly Detection & Trend Prediction
Zabbix is more than threshold alerts:
You can define triggers with complex conditions. It supports flexible logic, dependencies, and suppression rules.
It can detect anomalies (baseline deviations) and forecast when a metric may cross a critical threshold (trend prediction).
Automatic actions are supported – scripts or commands can run in response to triggers.
Notifications can go via email, SMS, messaging tools, or be integrated into ticketing/alert systems.
These features reduce noise, lower mean time to detection (MTTD), and help teams act before incidents escalate.
3. Scalability and Distributed Monitoring
Zabbix is built to grow:
With proxies and distributed architecture, it can monitor geographically dispersed sites without overloading the central server.
It handles large volumes of metrics and hosts – from small setups to enterprise scale.
Low-level discovery (automatic detection of interfaces, file systems, etc.) and dynamic template-based monitoring let you scale more efficiently.
4. Visualization, Reporting & Analytics
To turn data into insight:
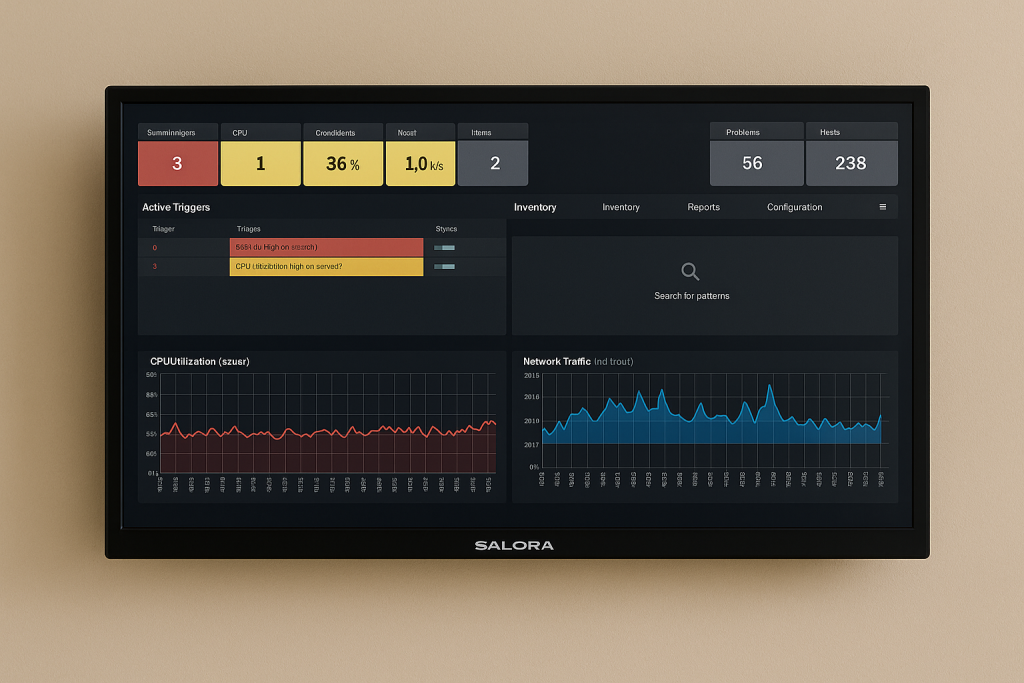
Dashboards, graphs, maps, slideshows, and reports let you visualize performance and topology.
Scheduled reports (daily, weekly, monthly) help you track trends and share status with stakeholders.
Audit logs track changes to configuration, alerts, and user actions for security and compliance. Because all data is stored over time, historical analysis, trend lines, capacity planning become possible.
5. Cost Efficiency & Open Source Freedom
One major benefit: Zabbix is open source, no per-host license fees.
You scale based on hardware, not software licenses.
You avoid vendor lock-in.
The model encourages transparency, community-driven extensions, and flexibility.
Many organizations see significant cost savings when consolidating multiple tools into Zabbix.
6. Integrations & Extensibility
Zabbix enables deep integration into your ecosystem:
You can use APIs to script, automate, or integrate with orchestration, ticketing, or dashboard platforms (Grafana, ITSM, etc.).
Custom checks, external scripts, plugins, all supported.
Multi-tenant or segmented setups are possible, beneficial for managed service providers (MSPs).
Challenges & Considerations (so you plan well)
No system is perfect. Here are things to keep in mind:
Learning Curve & Setup Complexity – Because it’s powerful and versatile, configuring Zabbix properly takes time and expertise. Resource Demands – At scale, the server, database, and proxies need proper sizing.
Database Optimization & Housekeeping – Maintaining performance over time requires thoughtful data retention, archive strategies, indexing, and cleanup.
Template Tuning – Out-of-the-box templates may collect too much data; customizing them to your environment is essential. Some users note this as a common pain point.
With professional guidance and experience, these challenges are manageable, and often outweighed by the benefits.
Why Taurix IT Recommends Zabbix
At Taurix, we see Zabbix as a strategic choice for modern infrastructure monitoring. Here’s how we add value:
Architectural design – We build scalable, high-availability Zabbix deployments tailored to your environment.
Templates & Tuning – We refine monitoring templates, optimize triggers and metrics so you monitor what matters.
Automation & Integration – We integrate Zabbix into your CI/CD, alerting tools, dashboards, and operational workflows.
Training & Support – We train your teams, provide maintenance, optimizations, and long-term support.
Cost-focused approach – Because Zabbix is open source, we focus your spending on infrastructure and operational efficiency, not licenses.
If you’re seeking a unified, powerful monitoring platform that scales with your growth and remains adaptable – Zabbix is a compelling choice.


